Monday, October 25, 2010

Secret Wars: Previewing Heroes & Villains for the 2011 NBA Season with ESPN and Marvel Comics, Part 1


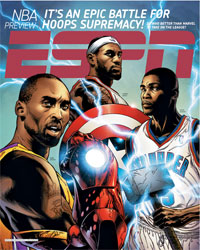
It's time for NBA season previews and ESPN the Magazine has put forth the most interesting effort by using Marvel superheroes and illustrators to come up with variant comic book covers for each team (Insider access required). Honestly, the idea was genius and the outcome was pretty tremendous but there were a few covers that could have been better. I'm going to preview the NBA season with a rundown of the good (heroes), bad (villains) and the ugly (anti-heroes) from Marvel's variant NBA covers.  All images used for this post appear courtesy of comicvine.com.  This is Part 1, a review of the Western Conference. Part 2 reviews the Eastern Conference.

Western Conference


After shooting 28% in the preseason while recovering
from knee surgery, Kobe Bryant could use an onboard
computer for his shot and armor to get through
the season intact for the playoffs.
#1. Lakers (58-24)
Cover Rating - Villains: I liked the idea of an Iron Man cover for the LA Lakers until I realized that it was Iron Man's nemesis, the Mandarin, that had the rings of power.  That being the case, it doesn't really make sense to show Kobe Bryant getting strapped into Tony Starks' armor wearing five rings.  You know what else doesn't make sense?  How the rest of the Western Conference isn't really trying to surpass the Lakers.  While the Celtics, Heat, Bulls and Magic are stacking chips and pushing them to the middle of the table in the Eastern Conference, the teams in the Western Conference are just folding like "Japan's futons and fans."  Word to Black Thought from The Roots, "If you know like I know, then you know the motto - that's all this fraud $#!t got to go..." The Lakers will be the #1 seed in the West until Kobe's derailed by injuries or Sam Presti makes a big trade to bring a legitimate third star to Oklahoma City.


With Tony Parker's contract expiring, should the Spurs
"Big Three" be disassembled after the season if they
don't seriously challenge for the title?
#2. Spurs (56-26)
Cover Rating - Villains: Marvel illustrated Thor, Iron Man and Captain America paying homage to Manu Ginobili, Tim Duncan and Tony Parker is about as boring as the Spurs are every season.  It's the same-old story by the Riverwalk - Duncan's a hall-of-famer, Ginobili is probably the most underrated guard in the league and Tony Parker's always a threat to lead the league in points scored in the paint when he's coming off the pick-and-roll with Duncan.  The interesting aspect of the Spurs is what Dejuan Blair and Tiago Splitter will bring to the frontcourt.  Blair was a monster on the boards last year and Splitter outplayed all of Team USA's centers in their FIBA World Championships matchup.  I think they'll be enough to push the Spurs to a #2 seed if Parker, Ginobili and Duncan can stay healthy.


If Greg Oden and Brandon Roy had cybernetic parts like
Deathlok, then the Blazers could come out with guns
blazing in the Western Conference.
    #3. TrailBlazers (54-28)
    Cover Rating - Heroes: A Deathlok cover with Greg Oden, Brandon Roy and Joel Pryzbilla getting fitted for cyborg parts was perfect. The Portland TrailBlazers could have been the #2 seed in the Western Conference if they were healthy last season, but of course, they weren't and the season ended with another first round playoff exit. At least the owner, Paul Allen, realized the team's general manager was an idiot for drafting Oden over Kevin Durant and summarily fired him. If he could just get Microsoft to come up with those bionic parts for the Blazers' injury-prone players, then they could be the best in the West. Until then, I don't see the Blazers finishing higher than the 3rd seed.


      Despite all the hype about his resources, innovation
      and dedication to winning, the Mavs have mostly been
      ants led to sledgehammers in the playoffs during
      Mark Cuban's ownership.
      #4. Mavericks (52-30)
      Cover Rating - Villains: It says a lot about a franchise when the owner is on the variant cover and what it means is that the Dallas Mavericks are not a title contender. Mark Cuban as Ant-Man? He was always a wack hero to me and that's probably appropriate for the Mavs. They've been a wack franchise since they were run out of the first round with 67 wins by the 8th-seed Golden State Warriors. I would like to ask the cover artist, Kyle Baker, why is Dirk Nowitzki the only recognizable player on the cover? Oh, that's right - because he's probably the only player on the roster that any other team in the league would want. As one of the most durable players at his position, Dirk will probably log his seventh season with 3000+ minutes and lead the Mavs to home-court advantage in another first round playoff beatdown, which is the way they've exited the playoffs in three of the last four years.


      Despite the hype, the Gods of Thunder will have a hard
      time getting out from under the heel of the established
      powers in the Western Conference.
      #5. Thunder (51-31)
      Cover Rating - Anti-Heroes: The cover with Kevin Durant and Thor was so well illustrated that I really wanted to like it but I couldn't. I don't care about the similarities with a comic about the mythical god of thunder being based in Oklahoma. The best nickname given to Durant is "Durantula" and the best character for the cover would've been Spider-Man. Durant and Peter Parker are both mild-mannered young men with funny, trash-talking sides that are only revealed when they don their respective uniforms. Thanks to Phoenix and Utah (probably Denver, too) losing key starters to teams in the East, I think the NBA's friendly neighborhood scoring champion will be able to swing into the #5 seed this season, but won't be able to get any higher until Sam Presti gets them some more help. Daequan Cook (-0.040 WP48), Morris Peterson (0.033 WP48) and Cole Aldrich (projected WP48 between 0.038 and 0.051 as a rookie) don't impress me.


      Hornets fans may hope that new GM Dell Demps is an Angel that
      can convince Chris Paul to stay, but the Archangel of CAA will
      prevail and get their client whatever he wants.
      #6. Hornets (50-32)
      Cover Rating - Villains: I loved Marvel's Archangel character and thought it was clever having Angel and Archangel sitting on Chris Paul's shoulders giving him advice about whether to stay with the New Orleans Hornets or force a trade to another team with a superstar. With that said, the cover was boring and I don't like my comic books or my NBA superstars boring. CP3 is one of the most exciting players in the league and deserved a more exciting illustration. If he stays in N'awlins, then they're guaranteed a playoff berth. Despite only playing 45 games, CP3 was still the fifth-most productive point guard in the league last year with nearly 12 Wins Produced. With a full season, he can lead Marcus Thornton, Trevor Ariza, David West and Emeka Okafor to 50 wins.  Whether or not he wants to do that is a different issue entirely.


      Like Bullseye, Marvel Comics' greatest marksman, the
      Warriors are a can't-miss pick for the playoffs.
      #7. Warriors (48-34)
      Cover Rating - Anti-Heroes: The artwork for the Golden State Warriors cover was fine, but the character selection was a little underwhelming. Bullseye? Who cares? The Warriors may have been an afterthought in the past, but this season the additions of David Lee, Dorell Wright and Louis Amundson along with the return of Andris Biedrins could bring more than 20 extra wins if they stay healthy. That will be enough to get the Warriors at least 45-50 wins and their second playoff berth in 17 years.


      Not even the most powerful force in the universe will be
      able to get Steve Nash back to the Western Conference
      Finals.
      #8. Suns (46-36)
      Cover Rating - Anti-Heroes: I thought the use of the Phoenix Force for the Phoenix Suns was an obvious pick and a little cheesy. I also thought it was cheesy for the Suns to tell Amare Stoudemire (9.1 Wins Produced) to kick rocks so they could sign Hedo Turkoglu (4.2 Wins Produced) and Hakim Warrick (1.8 Wins Produced). Josh Childress was very productive when he was in the league three years ago and produced 0.239 WP48, but I don't see where the minutes are going to come from to get him on the floor without sacrificing too much size. Steve Nash is not as powerful as Marvel's Phoenix Force, but he should have enough left to get the Suns into the playoffs.


      Carmelo Anthony's inevitable exit from Denver will be
      blamed when the team misses the playoffs for the first
      time in seven years - even if it's not the real reason.
      #9. Nuggets (44-38)
      Cover Rating - Heroes: The remake of the classic X-Men cover with Cyclops leaving everybody's favorite band of mutants behind perfectly sums up the Denver Nuggets and their season. Carmelo Anthony obviously wants to leave Denver and Chris Andersen is clearly a mutant. If the Nuggets can get an average small forward back for Anthony, then they may survive losing him. What they can't survive is replacing Kenyon Martin and Chris Andersen with Al Harrington and Shelden Williams for an extended period of time. K-Mart and Birdman produced 14 wins for the Nuggets last season. Harrington and Williams would produce about 10 wins less than that if given the same amount of minutes. So Melo may grab all the headlines but the rehab of K-Mart and Birdman's knees may be more important. One last thing on Melo - it will not be easy to just replace him with "an average player." While Melo ranked 15th in Wins Produced amongst NBA small forwards last year, there were only five players at the position that played more than 2,500 minutes and produced more wins than him last season - LeBron James, Kevin Durant, Gerald Wallace, Andre Iguodala and Luol Deng. If Denver gets anyone else back in a trade, then it means more minutes for a benchwarmer like Renaldo Balkman or an unproductive player like Al Harrington and that won't help them make the playoffs.


      Deron Williams is not the best PG in the NBA.
      #10. Jazz (42-40)
      Cover Rating - Anti-Heroes: Sorry, I just didn't buy Deron Williams as Daredevil, the "Man Without Peer." First of all, his court vision isn't on the level of Steve Nash or Jason Kidd. Secondly, he's not a better point guard than Chris Paul and legitimate cases can be made for Rajon Rondo and Nash, as well, so he has plenty of peers. What he won't have this season is a top five power forward (Carlos Boozer) or the league's best three-point shooter (Kyle Korver). Spending a few seasons flirting with the luxury tax finally caught up with the Jazz in 2010. Twenty-six wins left the roster and I only expect around 15 wins to come back from players acquired in trades, free agent signings and the draft. After four consecutive playoff appearances, it looks like the Jazz will be singing a different tune when the regular season ends this year.


      Yao Ming needs an adamantium skeleton (claws optional)
      to get the Rockets into the playoffs.
      #11. Rockets (40-42)
      Cover Rating - Heroes: Yao Ming as Weapon Y is science fiction at its best. If Ming's skeleton was bonded with adamantium, there's no telling how dominant he would be in the NBA. In the real world, his brittle bones will cost the Houston Rockets about eight wins this year as he plays limited minutes and Houston will be limited to just playing in the regular season. How long before the owner, Les Alexander, has the same epiphany Paul Allen had and fires the media-darling GM that hasn't been able to turn his team back into a title contender?


      After an undefeated preseason, can the Grizzlies give
      playoff contenders nightmares in the Western Conference?
      #12. Grizzlies (40-42)
      Cover Rating - Villains: The Memphis Grizzlies had the lamest cover in the entire issue. ESPN and Marvel chose Captain America because the Grizzlies' need leadership in the locker room? Whatever. How about some leadership on the court? Twenty-four NBA teams had point guards that produced more wins than Mike Conley last season. After last season's 16-win improvement and an undefeated preseason this year, I think the New Mutants would've been a more appropriate cover for the Grizzlies but I don't think that success will translate to a playoff berth until they add better players than Tony Allen, Acie Law and Damien Wilkins to the roster.


      Will the young Kings follow Tyreke Evans if he
      sets his sights on the playoffs?
      #13. Kings (38-44)
      Cover Rating - Heroes: The X-Babies make a good metaphor for the Sacramento Kings. Only two players on the roster that were in the team's top six for minutes played last season are over the age of 25 (when the average NBA player stops improving their productivity). They've added DeMarcus Cousins (age 20) who will see significant minutes while Samuel Dalembert is out with a groin injury. The Kings' youth movement could result in six extra wins as the young players improve and DeMarcus Cousins makes an impact. The big boost, however, could come from replacing Spencer Hawes with Dalembert. If he returns from his groin injury to play 1500+ minutes, then he could provide eight more wins than Hawes did last year. A 14-win improvement would boost the Kings to the 40-win territory, similar to the Memphis Grizzlies last season. Unfortunately, the Grizzlies didn't make the playoffs last season and I don't see the baby Kings making it this season.


      Brain freeze in the front office will keep the T-Wolves
      frozen in mediocrity this season.
      #14. Timberwolves (25-57)
      Cover Rating - Anti-Heroes: I liked the concept of the Minnesota Timberwolves being frozen in place by the Iceman but I don't think the Iceman is Ricky Rubio. I think it's David Kahn with brain freeze. Whether he's wasting a pick on Rubio, money on new practice facilities or both on a half-dozen point guards, a half-dozen small forwards and garbage European centers, it doesn't matter. Kahn has lost a projected 19.3 Wins Produced in his transactions listed at basketball-reference.com (that count includes projected performances for rookies). Fifteen of those wins were lost in one of Kahn's first moves as GM - trading Randy Foye and Mike Miller to the Wizards for the #5 pick in the 2009 draft which was used on Ricky Rubio.  In 67.5 minutes played in three games against Team USA in the last three years, Rubio has produced an estimated 0.4 wins and 0.290 Est. WP48 (for 2008 games, see the spreadsheets HERE; for the 2010 game, see the GCC-ESP spreadsheet HERE). At that rate of productivity, it would only take Rubio 2,483 minutes to produce 15 wins. That means if he ever played for Minnesota, Kahn would get the return on his investment in Rubio's rookie year. Of course, I don't think he'll ever play for Minnesota, which leaves Timberwolves fans out in the cold with Kahn's brain freeze.


      Blake Griffin will smash and Blake Griffin will eventually
      break down as a result.
      #15. Clippers (24-58)
      Cover Rating - Heroes: Marvel's cover with Blake Griffin as the Incredible Hulk carrying the LA Clippers on his back was on point in more ways than one. Griffin could be worth 10 wins to the Clippers. That would have made him the most productive player on the team last season if he could have stayed healthy. Unfortunately, he recklessly leaps around the court like the Hulk recklessly leaps around the Midwest. Without the Hulk's incredible healing factor, I don't think he can stay healthy enough to carry the Clippers and there's no one else around to pick up the slack.  There is only one player on the roster whose productivity was above average last season - Baron Davis (0.117 WP48). With a team this bad, I think he gave up on the season before it started.  There's no way for the Clippers to avoid being the worst team in the West if they don't have Griffin.

      Unless referenced otherwise, all stats used in this post were taken from the Wins Produced Viewer, Wages of Wins website and basketball-reference.com.

      Wednesday, October 13, 2010

      Heat Produced: Miami Is Udonis Haslem's Team Halfway Through The Pre-Season

      After Tuesday night's game against CSKA Moscow, the Heat were halfway through their pre-season schedule.  Let's see what the Win Score and Estimated Wins Produced stats have to say about the players' performance so far.  The spreadsheets below summarize each player's overall productivity as well as their productivity in each pre-season game.


      Win Score and Estimated Wins Produced are statistical models created by Professor David Berri from the Wages of Wins Journal to measure how much a player's boxscore statistics contributes to their team's wins.  An average player produces an estimated 0.100 wins per 48 minutes (EWP48). More information on these stats can be found at the following links:


      Simple Models of Player Performance
      Wins Produced vs. Win Score
      What Wins Produced Says and What It Does Not Say
      Introducing PAWSmin — and a Defense of Box Score Statistics


      Most Heat Produced: Udonis Haslem
      When Dwyane Wade limped off the court with a hamstring injury just three minutes into the pre-season, most reporters wrote that the Heat were now LeBron James' team.  The truth of the matter, however, is that Udonis Haslem has been the most productive player for Miami in the pre-season with an estimated 0.8 wins produced in just 79.8 minutes over three games.  He was the most productive player against Detroit and Oklahoma City and has been almost three times more productive this pre-season (with a 0.476 EWP48) than he was all of last season (with a 0.160 WP48).


      Alternative Energy Sources: LeBron James and Chris Bosh
      As expected, two of the Heat's top three producers are LeBron James and Chris Bosh.  Each has had one bad game in the pre-season but have both played like superstars otherwise.  LeBron's bad game was his first one for the Heat when he got up as many shots as he could but sunk his productivity into the negative range.  I don't know if LeBron has been trying to make up for the loss of Wade in the pre-season or just trying to put on a show for the fans but after four games he's averaging about three more shot attempts per 48 minutes than he did in Cleveland last season and has not been as efficient.  So far his shooting efficiency has declined from 54.5% last season to 48% this pre-season.  Outside of the shooting efficiency, his production is pretty close to what he provided last year and if you throw out the first pre-season game, his EWP48 jumps to 0.395 (which is much closer to the expected 0.400+ production from the NBA's reigning MVP).  Hopefully, the cramps in his legs from last night's game won't prevent LeBron from getting all the way back into MVP form before the season-opener in Boston.


      Unlike LeBron, Bosh has been much better than expected if you throw out his one bad game on the second night of a back-to-back against the Spurs (Haslem being the most productive power forward on the team was also unexpected but  I think they should play Bosh at center anyway).  If you throw out the game in San Antonio, Bosh's EWP48 jumps 100 points to 0.358.  Bosh's shot attempts have slightly increased from last season but he's only gotten to the free throw line half as much in the pre-season as he did last year.  His increased shooting efficiency has helped him keep his scoring average within two points of last year's number per 48 minutes.  His rebounding numbers are way down but he's increased his steals and decreased his turnovers to keep the net possessions he provides close to last season's number.  Lastly, there haven't been too many shots sent flying out of the "Bosh Pit" but with Joel Anthony blocking six shots per 48 minutes, I don't think the Heat need another shot-blocker right now. Of course, when Anthony's not in the game, Bosh will have to be more of a presence in the paint.


      Burnouts: Kenny Hasbrouck and Shavlik Randolph
      Five Heat players have provided sub-zero productivity in the pre-season - Kenny Hasbrouck, Shavlik Randolph, Anthony Mason Jr, Mickell Gladness and Jamaal Magloire.  Mason and Gladness were already cut and Magloire has only played 7.6 minutes.  Since Magloire's a veteran, I think it's safe to say he'll return back to the positive production he provided last year.  That leaves Hasbrouck and Randolph fighting Da'Sean Butler for the 15th spot on the roster.  If they can't find a way to be more productive than a guy who isn't even playing, then they deserve to be cut well before the October 25th deadline to ensure they don't even take up a D-League roster spot.  They've both been above average at getting their shot off but not much else. Hasbrouck has been below average in every other category except assists.  Randolph has been below average in every other category except for rebounds and blocked shots.  At least they'll get to take home some nice parting gifts - a combined $1.75 million.


      Ambient Heat: Is Patrick Beverley Productive Or Just Healthy And Hungry?
      Beverley has definitely taken advantage of the fact that he's the only fully healthy PG on the Heat roster.  Chalmers is playing, but still recovering from the high ankle sprain he sustained this summer; Arroyo suffered a bad thigh bruise in the FIBA World Championships; and Eddie House is still recovering from off-season shoulder surgery.  Those injuries have allowed Beverley to log a team-high 81.9 minutes at point guard and produce an amazing 0.198 EWP48 and 0.3 estimated wins (good for 5th on the team).  I say it's amazing because he was the least productive guard for Miami in the Vegas Summer League this year with a -0.067 EWP48.  Beverley's poor production in the summer league makes me skeptical of his pre-season numbers.  While he's been productive, I think his numbers could be representative of a "looter in a riot" as Kenny Smith would say.  Despite being very productive, his plus-minus for the pre-season is -25.  That leads me to believe he could just be racking up numbers in garbage time like the double-double he posted in a 17-point loss to the Spurs.  I like the fact that he's healthy, appears to be hungry and is much more productive against what is likely the same level of competition he faced in summer league, but I'm not sure if he's more deserving of a spot on the roster than Dexter Pittman.  Pittman, however, isn't exactly making a strong case for playing in South Beach instead of Sioux Falls.


      Like Beverley, Pittman was the worst player at his position for the Heat in the Vegas Summer League.  Unlike Beverley, Pittman has only  produced 0.007 EWP48 after three pre-season games.  Beverley has improved his free throw shooting, scoring, rebounding and passing while reducing his turnovers and personal fouls.  His shooting efficiency has gotten worse (I didn't really think it was possible for a guard to shoot worse than 34.8%) but his improvement has been somewhat remarkable.  Pittman improved his shooting efficiency (which subsequently improved his scoring) but he's continued to struggle with the other facets of his game. His rebounds and blocked shots have declined while his turnovers and fouls have increased. With three centers on the roster in addition to Bosh, Haslem and Howard, it might be best to send Pittman to the D-League this season and let him continue to shed pounds while developing his game.


      15-Man Roster Prediction Halfway Through the Pre-Season
      Based on the Heat Produced halfway through the pre-season, the opening night roster should be as follows:


      POSITION - PLAYER (PRE-SEASON EWP/EWP48)
      PG - C. Arroyo, P. Beverley, M. Chalmers
      SG - D. Wade, M. Miller, E. House
      SF - L. James, J. Jones
      PF - U. Haslem, J. Howard
      C - C. Bosh, Z. Ilgauskas, J. Anthony, J. Magloire, D. Pittman

      Of course, I realize that's probably not what it's going to look like. It will probably look more like this:

      POSITION - PLAYER (PRE-SEASON EWP/EWP48)
      PG - C. Arroyo, M. Chalmers, P. Beverley
      SG - D. Wade, M. Miller, E. House
      SF - L. James, J. Jones
      PF - C. Bosh, U. Haslem, J. Howard
      C - J. Anthony, Z. Ilgauskas, J. Magloire, D. Pittman

      Either way, with this much talent Erik Spoelstra really can't go wrong.


      Statistics for Heat players from the Vegas Summer League mentioned in this article can be found in this spreadsheet or in this blog post.


      Like this post? It's even better with video! Check it out at Bleacher Report.

      Monday, October 11, 2010

      Running With The Bulls Without Erick Dampier

      I received the following comment on my last piece about the Heat winning 72 games, “Apparently the Heat don't care about 72 games, or they would have picked up Dampier.”  I’ve been looking through the numbers to see if there’s any statistical justification for declining to invite Erick Dampier to Heat training camp and I haven’t been able to find much.  Of course, the statistical models I used to guide my search were Win Score, Estimated Wins Produced, Estimated Wins Produced per 48 minutes (EWP48), Wins Produced and Wins Produced per 48 minutes (WP48).  An average player produces 0.100 wins per 48 minutes (WP48).  For more information on these stats can be found at the following links:

      Simple Models of Player Performance
      Wins Produced vs. Win Score
      What Wins Produced Says and What It Does Not Say
      Introducing PAWSmin — and a Defense of Box Score Statistics

      After searching for hours, I've come to the conclusion that there’s no way around it – Dampier’s better than any traditional center the Heat invited to camp.  Here’s a list of what the Heat could have expected each center to produce on a per-minute basis this season before training camp began.

      Productivity Forecast for Dampier & Heat Centers Invited to Training Camp
      Erick Dampier (Age 35):               0.130 WP48
      Joel Anthony (Age 28):                -0.034 WP48
      Zydrunas Ilgauskas (Age 35):       -0.060 WP48
      Jamaal Magloire (Age 32):             0.051 WP48
      Dexter Pittman (Age 22):              -0.499 EWP48 (2010 summer league production)
      Mickell Gladness (Age 24):           -0.348 EWP48 (2010 summer league production)

      The forecast is based on the impact of age on the performance of an average NBA player reported in Stumbling on Wins by David Berri and Martin Schmidt.

      Clearly, Dampier could improve the Heat’s production at the center position if he signed with the team and would increase the likelihood of winning more than 72 games.  Will the team regret telling him to kick rocks?  On another Miami Heat blog, Asylum For Ira’s Followers, a writer named Cyrus listed 10 reasons why the Heat won’t regret passing on Dampier.  Let’s see what Wins Produced has to say about the top five using original data from basketball-reference.com.

      1) Joel Anthony is one of the league's best shot blockers.  He averaged 1.4 blocks in just 16.5 minutes per game last season.  That projects to around three blocks per game if given starters minutes.  Miami had a 13-3 record during Joel's 16 starts last season.  While he is still raw in many aspects of the game, he sets excellent, crushing screens and keeps balls alive on the offensive glass.  He is not an excellent on the boards and still struggles catching the ball cleanly, but his intangibles have earned him a five-year, $18 million extension.  He could be the starting center for years to come if he can maintain last year's winning ways—it projects to 67 wins over the course of a season, by the way.

      What Wins Produced Has To Say:
      Anthony averaged 27.6 minutes in 16 games as a starter last season.  As a starter, his shot-blocking averaged decreased by 16% to 1.9 per game.  Coincidentally, his foul rate also decreased by 22% as a starter.  My guess is that Anthony couldn’t be as aggressive blocking shots as a starter last year because the Heat didn’t have a lot of depth at the center position.  With Bosh, Haslem and potentially four centers on the final roster, Anthony should be able to remain an aggressive shot-blocker if he starts this season.  So, if he averages three blocks in 36 minutes per game for 80 games this season, then Anthony’s shot-blocking would be worth 4.2 wins to the Heat – that’s 1.3 wins more than Dampier’s shot-blocking would be worth in the same number of minutes.  Dampier, however, is coming off a season that only saw him play 55 games due to injuries.  If he’s limited to 55 games this season, then Anthony’s shot-blocking would be worth 2.2 more wins than Dampier’s.  The problem with Anthony, though, is that he does more than block shots when he’s on the floor – and he does almost all of it poorly.  His rebounding is below average, as Cyrus mentioned.  He’s also below average at his position when it comes to scoring, steals, assists and fouls.  The funny thing is that despite his reputation for having bad hands, he’s above average when it comes to protecting the ball from turnovers (which leads me to believe his teammates were credited with turnovers for the passes he dropped).  As for the Heat’s success with Anthony as a starter last season, it seemed to be in spite of him.  His performance actually cost the Heat an estimated 0.5 wins in the 16 games he started and that’s the problem with Joel Anthony.  When all the shot-blocking is done, and the rest of his stats are accounted for, Anthony is worth 5–10 wins less than Dampier as a starter (depending on Dampier’s health).

      2) Zydrunas Ilgauskas was one of the first veterans to jump on board and sign a minimum contract.  He has had an amazing career.  Yes, he had a down year last year, averaging 7.4 points and 5.4 rebounds in just 21 minutes of action per game, but was contributing 12.9 points and 7.5 rebounds in 27 minutes of action the year before Shaquille O'Neal was acquired.  That's a higher combination of points and rebounds than Dampier ever delivered for Dallas.  The perception may be that Ilgauskas is a dinosaur, but he is in fact just one month Dampier's senior.  LeBron still believes he has something left in the tank and they have great chemistry together.  I wouldn't be so sure that Ilgauskas will not have a better season than Erick Dampier.

      What Wins Produced Has To Say:
      Ilgauskas has been slightly above average for his career with an estimated 0.112 WP48 and an estimated 51 wins produced but his production fell off a cliff last season, which was the first time in his career that he wasn’t a starter.  He’s always been a better scorer than Dampier but not a better rebounder.  The season before Shaq came to Cleveland, Big Z averaged 13.3 rebounds per 48 minutes compared to Dampier’s 14.8 rebounds per 48 minutes.  The rebounding difference between Ilgauskas and Dampier is worth 1.5 wins (assuming both players came off the bench for 840 minutes during the season).  Big Z makes up for that deficiency with his superior scoring, free throw shooting and passing abilities, but not by much.  Those advantages for Ilgauskas are worth 2 more projected wins than Dampier would provide in those categories for a net advantage of 0.5 wins.  Unfortunately for the Heat, the disadvantages of choosing Ilgauskas over Dampier are not as slim.  Compared to the rest of the league’s centers, he was below average in getting to the line, scoring, rebounding, steals, shot-blocking, assists and fouls.  The result is that Big Z is projected to be worth 3.4 wins less than Dampier.  The decline in Big Z’s production from 2009 to 2010 was steeper than expected but an average player would still be expected to provide negative production at 35 years old.  If last season is ignored for Ilgauskas’s projection, then the forecast for his WP48 increases from -0.060 to 0.047.  While he would still be expected to be below average, the gap between his value and Dampier’s value as a backup playing 840 minutes would decrease from 3.4 wins to 1.4 wins.  Either way, Dampier remains a more productive player, despite being the same age as Ilgauskas.

      3) Jamaal Magloire was actually an All-Star in 2003-04, thanks to a weakened class of centers in the Eastern Conference, the last year either player averaged a double-double.  Nowadays, it is pretty widely accepted that Dampier is a more reliable option.  The 32-year-old Heat center now has three advantages over Mr. Dampier.  He is three years younger, has already accepted a bench role, and is the resident bad boy on the roster.  When the Heat and Celtics got into an altercation during last year's playoffs, Magloire was the intimidating presence that seemingly made Paul Pierce and Kevin Garnett reconsider whether they should exchange blows with Miami players.  Stan Van Gundy said it best "Jamaal Magloire has a role and that role is to beat the hell out of people."  He is not going anywhere.

      What Wins Produced Has To Say:
      Magloire is definitely better at beating the hell out of people than Dampier.  The Big Cat is projected to average 7.6 fouls per 48 minutes next season compared to Dampier’s 5.5 fouls per 48 minutes.  Magloire “beating the hell out of people” cost the Heat about 1 win last season while Dampier’s hacking cost the Mavericks 2.4 wins last season in about 3.5 times more minutes.  On a per minute basis, however, Dampier averages less fouls than all of the centers invited to Heat training camp.  Maybe that’s why the team wasn’t interested in Dampier – he wasn’t the enforcer they were looking for in the middle.

      4) Dexter Pittman was picked by Miami at the top of the second round ahead of potential lottery picks like Solomon Alabi and Hassan Whiteside.  When Riley says that he likes Dexter, you have to believe him, because he had a chance to draft either of the bigs that had lottery potential and passed in favor of the big man out of Texas…  He had his ups and downs during summer league play, but that was to be expected from the prospect who once weighed over 400 pounds.

      What Wins Produced Has To Say:
      Dexter Pittman was the 17th most productive NCAA player drafted, so he was definitely a smart second round draft pick for the Heat.  However, he was also the least productive player on the Heat summer league team with -0.173 EWP48 (good news for Heat fans is that Berri reported summer league performance doesn’t say much about regular season performance).  After three pre-season games, his productivity has improved to 0.004 EWP48 (good/bad news for Heat fans is that rookie pre-season performance is an indicator of regular season performance).  The swings in production from summer league to pre-season are good examples of the ups-and-downs that Cyrus was probably talking about.  Dampier was not a productive player his rookie season either, with -0.017 EWP48.  In fact, he produced less than zero estimated wins in five of his first six seasons in the league.  In six years, maybe Pittman will become as productive as Dampier and the Heat will have a productive center but for now, the doughnut remains.

      5) Chris Bosh… Expect Bosh to play the Gasol role in Miami if the other centers are not earning their minutes.

      What Wins Produced Has To Say:
      Bosh is more than capable of filling in at center.  Last season, he was the sixth most productive player in the NBA at center with 11.7 wins produced in 2,526 minutes.  Dampier was only able to play half that many minutes last season and has only played more than 2,500 minutes once in his career.  Bosh produced 7.5 more wins at center than Dampier last season.  After Saturday’s pre-season game against the Spurs, South Florida Sun-Sentinel reporter Ira Winderman reported the following on his blog:

      “Spoelstra said he does not see an issue occasionally casting Bosh at center.  ‘I think the more you ask him, the less he’ll care,’ he said, ‘especially when you’re flanked by a warrior like Udonis Haslem.’
      Spoelstra said he likes the combination of Bosh and Haslem, who was held out Saturday due to a sore shoulder.  ‘It’s also a dynamic rebounding duo for us and offensively it gives us some versatility,’ Spoelstra said.”

      I think playing Bosh at center gives the Heat their best chance of breaking the ’96 Bulls’ record of 72 wins because it will allow Haslem to play over 2,000 minutes at power forward.  A lineup with that frontcourt, Carlos Arroyo as the starting point guard and Mike Miller as sixth man (splitting time between shooting guard and small forward), would provide 73 wins by itself, as illustrated in the table below.


      The Wins Produced for LeBron James, Dwyane Wade and Chris Bosh were taken from HERE.  The Wins Produced for Arroyo, Haslem and Miller were calculated using numbers from the Wins Produced Viewer and are based on the impact of age on performance as reported in Stumbling On Wins.

      With the top six players producing nearly 74 wins, the only thing that could prevent the Heat from breaking the record would be negative productivity from the bottom six players on the rosters.  The bottom six players for the ’96 Bulls produced -6.1 wins.  Five of the eight veterans invited to training camp for the 2011 Heat produced less than zero wins last season – Zydrunas Ilgauskas, Eddie House, Juwan Howard, Joel Anthony and Shavlik Randolph.  Strangely enough, garbage time for the Heat this season could be the difference between a great regular season and the greatest regular season of all-time.  And maybe that's where the Heat will regret not signing Dampier - he would've been one less garbage player to put on the floor when the game's out of reach.

      Saturday, October 2, 2010

      Running With the Bulls: Miami Heat May Need More From Erik Spoelstra and Chris Bosh for 72 Wins

      Experts weigh in on Heat challenging for wins record: South Florida Sun-Sentinel Staff writer Ira Winderman asked a panel of four NBA experts to compare the 1995-96 Chicago Bulls, who set an NBA record with a 72-10 regular-season record, and the 2010-11 Miami Heat, who some think can challenge that mark. Winderman asked Sam Smith of Bulls.com, Steve Smith of NBATV, Alvin Gentry of the Phoenix Suns and Jack Ramsay of ESPN to compare the two teams in seven categories - Leading Man, Running Mate, Power Keys, Contributing Wings, Primary Big Men, Supporting Cast and Head Coach. Lets compare the experts' opinions from Winderman's article to what Wins Produced had to say.

      Wins Produced was developed by Prof. David Berri from the Wages of Wins Journal.  It calculates a player's individual contributions to their team's wins based on box score statistics.  Wins Produced per 48 Minutes (WP48) measures those contributions on a per-minute basis.  An average player produces 0.100 wins per 48 minutes.  Win Score is a simpler calculation that can be used to estimate wins produced and WP48.
      For more information on Wins Produced and Win Score, see the links listed below.

      Simple Models of Player Performance
      Wins Produced vs. Win Score
      What Wins Produced Says and What It Does Not Say
      Introducing PAWSmin — and a Defense of Box Score Statistics

      Leading Man
      The first comparison was Michael Jordan for the 1996 Bulls vs. LeBron James for the 2011 Heat. The panel unanimously gave the nod to Michael Jordan. Here's what Wins Produced has to say:

      PLAYER (SEASON): WP48, WINS PRODUCED
      Michael Jordan (1995-96): 0.386 WP48, 24.9 Wins Produced
      LeBron James (2010-11): 0.452 WP48, 27.9 Wins Produced

      Michael Jordan's numbers were taken from HERE.
      The forecast for LeBron James' numbers was taken from HERE and was calculated using his minutes played from 2010.

      Wins Produced says that LeBron's expected performance for the 2011 Heat should get the nod over Jordan's performance for the 1996 Bulls. While I understand that most reporters and analysts consider Michael Jordan to be the best player in NBA history, I didn't understand the panel's reasons for picking a 32 year-old Jordan over a 25 year-old LeBron. If the comparison was between a 25 year-old Jordan and 25 year-old LeBron, then it wouldn't be close. Jordan produced an estimated 34.1 wins with a 0.502 WP48 when he was 25. Here are some of the panel's justifications for choosing Jordan at age 32 over LeBron at age 25:

      Sam Smith: LeBron demonstrated by his choice that he's not a leading man. Michael is a leading man, a guy who is going to carry a team.

      This is more of the same garbage that haters have been throwing around all summer - "an alpha dog/male would never choose to join forces with another alpha dog/male." That argument is garbage for many reasons but lets start with the fact that human beings aren't animals (despite repeated attempts to describe black people that way) and lets end with Doc Rivers' de-bunking the myth that legends from the 80's and 90's wouldn't have done the same thing as LeBron.

      Steve Smith: "Michael was just at a different place at that time. He was older, more experienced, more primed to win a championship."

      How was Jordan "more primed to win a championship" at 32 years-old than LeBron at age 25? Jordan had already won three titles! Lets say I concede that Jordan entered the '96 season with a larger chip on his shoulder than usual because the '95 season ended with a loss to the Orlando Magic in the Eastern Conference semi-finals, he blamed himself for the loss because he was rusty from taking two years off to play baseball and he vowed to redeem himself and take revenge on the entire league. Doesn't LeBron have a larger chip on his shoulder after being ridiculed and hated on all summer by everyone from fans to hall-of-famers and getting beatdown in the playoffs for a second straight season despite having the best record in the league? And that doesn't even take into consideration that he hasn't won a title and is starving for one - it's the primary reason he signed with the Heat! Watch him at media day and tell me he doesn't seem "primed to win a championship."

      Jack Ramsay: "Michael. He's the better all-around player."

      Because I've lived through this era of Jordan-worship, I was predisposed to believe Ramsay's point until I saw that LeBron was the more productive player. The figure below compares Jordan's box score statistics from 1996 to LeBron's from 2010.

      STATISTIC - MJ (Avg. per 48 mins) / LBJ (Avg. per 48 mins)
      Points per shot - Jordan (1.05) / LeBron (1.09)
      Adj. shooting % - Jordan (52.4%) / LeBron (54.5 %)
      Free throw % - Jordan (83.4%) / LeBron (76.7%)
      Shot attempts - Jordan (28.8) / LeBron (24.7)
      FT attempts - Jordan (10.2) / LeBron (12.6)
      Points scored - Jordan (38.7) / LeBron (36.6)
      Rebounds - Jordan (8.4) / LeBron (9.0)
      Steals - Jordan (2.8) / LeBron (2.0)
      Turnovers - Jordan (3.1) / LeBron (4.2)
      Net Possessions - Jordan (8.1) / LeBron (6.8)
      Blocked shots - Jordan (0.6) / LeBron (1.2)
      Assists - Jordan (5.5) / LeBron (10.6)
      Personal fouls - Jordan (3.1) / LeBron (2.0)

      Points per shot (PPS) = (PTS-FTM)/FTA; Adj. shooting % = PPS/2; Net possessions = (REBS+STL-TO). Original data taken from basketball-reference.com.

      Wow... it's pretty close. The King is a more efficient shooter but His Airness was a better volume scorer. LeBron is a better rebounder but '96 Jordan was better at acquiring and protecting possessions for his team. Finally, LeBron is better at shot-blocking, passing and avoiding fouls than Jordan was on that record-setting Bulls team. So Dr. Jack was wrong - at 32 years-old, Jordan was not a better all-around player than a 25 year-old LeBron.
      What Wins Produced Says: 2011 LeBron is a better leading man than '96 Jordan.

      Running Mate
      The second comparison was '96 Scottie Pippen vs. 2011 Dwyane Wade. The panel was split 2-2. Here's what Wins Produced has to say:

      PLAYER (SEASON): WP48, WINS PRODUCED
      Scottie Pippen (1995-96): 0.269 WP48, 15.8 Wins Produced
      Dwyane Wade (2010-11): 0.248 WP48, 14.4 Wins Produced

      Scottie Pippen's numbers were taken from The Wages of Wins.
      The forecast for Dwyane Wade's numbers was taken from HERE and was calculated using his minutes played from 2010.

      Wins Produced agrees that it's a close contest between Pippen and Wade but Scottie was more productive in '96 than Wade is projected to be in 2011. Wade's projection is based on research of player performance declining with age from Stumbling on Wins but it is a projection, which means it's not a guarantee. Personally, I believe that Wade's performance will be closer to his 2009-levels since Pat Riley believes he might be in the same condition he was in after the 2008 Olympics when he produced 21.0 wins with 0.331 WP48 (see the Wages of Wins Journal). Winderman also reported that Heat coach Erik Spoelstra said Wade may be in his best shape ever.
      What Wins Produced Says: '96 Pippen was a better running mate than Wade will be in 2011.

      Power Keys
      The third comparison was of each team's power forwards. The panel chose the '96 Bulls power forwards (Dennis Rodman and Toni Kukoc) 3-1 over the Heat power forwards (Chris Bosh and Udonis Haslem). Here's what Wins Produced has to say:

      PLAYER (SEASON): WP48, WINS PRODUCED
      Dennis Rodman (1995-96): 0.415 WP48, 18.1 Wins Produced
      Toni Kukoc (1995-96): 0.193 WP48, 8.5 Wins Produced
      Chris Bosh (2010-11): 0.232 WP48, 12.2 Wins Produced
      Udonis Haslem (2009-10): 0.160 WP48, 7.3 Wins Produced

      Rodman and Kukoc's numbers were taken from The Wages of Wins.
      The forecast for Chris Bosh's numbers was taken from HERE and was calculated using his minutes played from 2010. Haslem's numbers were taken from the Wins Produced Viewer.

      The '96 Bulls had the better power forwards. In 4,191 minutes, Rodman and Kukoc combined to produce 26.6 wins with 0.305 WP48 while Bosh and Haslem only combined to produce 19.5 wins in 4,703 minutes with 0.199 WP48. The only member of the panel to pick the Heat power forwards was Ramsay. Here's his explanation:

      Jack Ramsay: "I think Bosh is the better all-around of that group. Rodman, of course, was a great defender and rebounder. I like Bosh very much. He's a very skilled player."

      The last time Ramsay said someone was a better all-around player he was wrong. Lets see if Wins Produced thinks he's more accurate this time.

      STATISTIC - Rodman (Avg. per 48 mins) / Bosh (Avg. per 48 mins)
      Points per shot - Rodman (0.96) / Bosh (1.05)
      Adj. shooting % - Rodman (47.9%) / Bosh (52.4%)
      Free throw % - Rodman (52.8%) / Bosh (79.7%)
      Shot attempts - Rodman (7.1) / Bosh (21.9)
      FT attempts - Rodman (2.5) / Bosh (11.2)
      Points scored - Rodman (8.1) / Bosh (31.9)
      Rebounds - Rodman (21.9) / Bosh (14.4)
      Steals - Rodman (0.9) / Bosh (0.8)
      Turnovers - Rodman (3.2) / Bosh (3.2)
      Net possessions - Rodman (19.6) / Bosh (12.0)
      Blocked shots - Rodman (0.6) / Bosh (1.3)
      Assists - Rodman (3.7) / Bosh (3.2)
      Personal Fouls - Rodman (4.6) / Bosh (3.2)

      Points per shot (PPS) = (PTS-FTM)/FTA; Adj. shooting % = PPS/2; Net possessions = (REBS+STL-TO). Original data taken from basketball-reference.com.

      Looks like Ramsay was right on this one. Bosh is indeed the better all-around player, surpassing Rodman in 9 statistical categories. He's better at shooting efficiency and volume, getting to the foul line, blocking shots and staying out of foul trouble. However, Rodman was so much better acquiring possession of the ball that he was much more productive than Bosh overall.
      What Wins Produced Says: Rodman and Kukoc were better power forwards for the '96 Bulls than Bosh and Haslem will be for the Heat in 2011.

      Contributing Wings
      The fourth comparison was between the top two perimeter players for each team - Ron Harper and Steve Kerr for the '96 Bulls vs. Mike Miller and Mario Chalmers for the 2011 Heat. The panel unanimously chose Harper and Kerr over Miller and Chalmers. Here's what Wins Produced has to say:

      PLAYER (SEASON): WP48, WINS PRODUCED
      Ron Harper (1995-96): 0.143 WP48, 5.6 Wins Produced
      Steve Kerr (1995-96): 0.129 WP48, 5.2 Wins Produced
      Mike Miller (2009-10): 0.230 WP48, 8.7 Wins Produced
      Mario Chalmers (2009-10): 0.035 WP48, 1.3 Wins Produced

      Harper and Kerr's numbers were taken from The Wages of Wins.
      Miller and Chalmers' numbers were taken from the Wins Produced Viewer.

      This one is close. In 3,805 minutes, Harper and Kerr combined to produce 10.8 wins with 0.136 WP48. In 3,612 minutes, Miller and Chalmers combined to produce 10.0 wins with 0.133 WP48. The Harper/Kerr combo for the '96 Bulls was more productive by a very slim margin.  The panel did give the Miller/Chalmers combo some credit but the key comment comes from Ramsay:

      Jack Ramsay: "None of those other guys can shoot like Kerr. Miller, I think, is a little better than average all-around. Chalmers has yet to be defined."


      Ramsay is right on two fronts - Miller is the best all-around player of the four and Chalmers has yet to be defined.  In his rookie season, Chalmers was much more productive with 0.099 WP48 and 5.4 wins produced.  If Chalmers and Coach Spoelstra can figure out a way for him to return to that level of productivity, then the Heat would have the advantage over the Harper/Kerr combo.  Until that happens, the '96 Bulls get the nod.
      What Wins Produced Says: Harper and Kerr were better contributing wings for the '96 Bulls than Miller and Chalmers are expected to be for the 2011 Heat.


      Primary Big Men
      The fifth comparison was between the big men for each team - Luc Longley and Bill Wennington for the '96 Bulls vs. Joel Anthony and Zydrunas Ilgauskas for the 2011 Heat.  The panel was split on this one 1-1-2 (two panelists thought they were even).  Here's what Wins Produced has to say:

      PLAYER (SEASON): WP48, WINS PRODUCED
      Luc Longley (1995-96): -0.016 WP48, -0.5 Wins Produced
      Bill Wennington (1995-96): -0.078 WP48, -1.7 Wins Produced
      Joel Anthony (2009-10): -0.017 WP48, -0.5 Wins Produced
      Zydrunas Ilgauskas (2009-10): -0.040 WP48, -1.1 Wins Produced


      Longley and Wennington's numbers were taken from The Wages of Wins.
      Anthony and Ilgauskas' numbers were taken from the Wins Produced Viewer.

      In a race to the bottom, the Anthony/Ilgauskas combo should be expected to have less of a negative impact than the Longley/Wennington combo had on the '96 Bulls.  Many pundits have cited the mediocre centers on the Heat roster as the roadblock that will prevent them from winning 70+ games and the NBA title but the Bulls were able to do it with even less productive players in the middle.  Here's what the authors of The Wages of Wins had to say about the '96 Bulls on pages 151-152:

      "The best team in NBA history did not have a center whose wins production exceeded zero... the productivity we observe from Chicago's centers leads us to conclude that the best team in the history of the NBA had little in the middle.  In essence, the best team was a doughnut."

      Yes, the Heat should expect nothing in the middle from Anthony or Ilgauskas but they can play Bosh at center and Haslem at power forward, so the lack of a dominant big man is not a reason to diminish their chances of winning more than 72 games.  Another interesting point is that the '96 Bulls had five centers on the roster (the other three were John Salley, Jack Haley and James Edwards) and the Heat also went into training camp with five big men on the roster (the other three are Jamaal Magloire, Juwan Howard and Dexter Pittman).  Maybe Jerry Krause and Pat Riley knew they had deficiencies in the middle and tried to compensate for it with quantity instead of quality.
      What Wins Produced Says: Anthony and Ilgauskas should be better big men for the 2011 Heat than Longley and Wennington were for the '96 Bulls.

      Supporting Cast
      The sixth comparison was between the supporting casts for each team - Jud Buechler, Randy Brown, Dickey Simpkins, James Edwards and Jason Caffey for the '96 Bulls vs. Eddie House, Juwan Howard, Jamaal Magloire and Carlos Arroyo for the 2011 Heat. The panel voted 3-1 for the Heat.  Here's what Wins Produced has to say:

      PLAYER (SEASON): WP48, WINS PRODUCED
      Jud Buechler (1995-96): 0.143 WP48, 2.2 Wins Produced
      Randy Brown (1995-96): 0.010 WP48, 0.1 Wins Produced
      Dickey Simpkins (1995-96): 0.007 WP48, 0.1 Wins Produced
      James Edwards (1995-96): -0.393 WP48, -2.2 Wins Produced
      Jason Caffey (1995-96): -0.136 WP48, -1.5 Wins Produced
      Eddie House (2009-10): -0.009 WP48, -0.2 Wins Produced
      Juwan Howard (2009-10): -0.002 WP48, -0.1 Wins Produced
      Jamaal Magloire (2009-10): 0.068 WP48, 0.5 Wins Produced
      Carlos Arroyo (2009-10): 0.095 WP48, 3.1 Wins Produced

      Numbers for the '96 Bulls were taken from The Wages of Wins.
      Numbers for Heat players were taken from the Wins Produced Viewer.

      Jud Buechler is the most productive player in that list but the '96 Bulls also had the two worst players - James Edwards and Jason Caffey.  Since the Heat supporting cast played more minutes last season for various teams, they were able to produce more wins so WP48 is a better tool for comparison.  The average WP48 for the '96 Bulls supporting cast is -0.021.  The average WP48 for the Heat players was 0.033 last season.
      What Wins Produced Says: 2011 Heat supporting cast should be better than the supporting cast for the '96 Bulls.

      Head Coach
      The final comparison was between the head coaches - Phil Jackson for the '96 Bulls vs. Erik Spoelstra for the 2011 Heat.  The panel unanimously voted for Jackson.  In Stumbling on Wins (the sequel to The Wages of Wins), the authors report that players "tend to get better when they come to Phil Jackson," (based on the results from a 2009 study of 62 NBA coaches from 1978 to 2008) and Prof. Berri told Toronto Star columnist Dave Feschuk that "players don't get worse after they leave Jackson".  The study suggested that Jackson is worth an additional 17 wins in his first year with a team - more than any other coach.  Spoelstra was not included in the study since he didn't become a head coach until the 2009 season.  Despite a 28-win improvement when he took over the team in 2009 and a four-win improvement in 2010, 11 of the 20 players coached by Spoelstra had a higher Win Score when they played for other coaches.
      What Wins Produced Says: Jackson was likely a better head coach in '96 than Spoelstra will be in 2011

      Summary
      After seven comparisons, here's the rundown:

      Leading Man - 2011 Heat
      Running Mate - '96 Bulls
      Power Keys - '96 Bulls
      Contributing Wings - '96 Bulls
      Primary Big Men - 2011 Heat
      Supporting Cast - 2011 Heat
      Head Coach - '96 Bulls

      The '96 Bulls were better than the Heat in four of the seven categories, but if Wade doesn't decline as Berri projected and Chalmers can produce like he did during his rookie season, then the Heat would surpass the '96 Bulls in every category except Power Keys and Coaching.  Do the Heat need to match the '96 Bulls in all seven categories to win more than 72 games in 2011?  I don't know.  Another Wages of Wins Journalist, Arturo Galletti, only projected the Heat to win 68 games in his last revision.  Only time will tell if the Heat need better coaching from Spoelstra or more productivity from Bosh and Haslem to get an extra five wins and break the '96 Bulls' 72-win record.

      Wednesday, September 29, 2010

      Like Father, Like Son? Heat Sign Anthony Mason Jr.


      HEAT Sign Anthony Mason Jr. & Mickell Gladness

      The Heat announced that Anthony Mason, Jr. and Mickell Gladness were the last two players signed for training camp. My first post on this blog, The Bottom Three, reported the productivity of the Heat Summer League team and whether the best players were chosen for the bottom three spots on the roster. Anthony Mason, Jr. and Mickell Gladness were invited to participate in Vegas but Mason Jr. didn't play a single minute for the Heat in summer league so I can't directly compare him to the bottom three of Shavlik Randolph, Kenny Hasbrouck and Dexter Pittman based on productivity against entry-level NBA competition but I can do that for Gladness.  Gladness was one of the least productive players for the Heat in summer league.  He produced an estimated -0.048 wins in 29 minutes.  Patrick Beverley and Dexter Pittman were the only two players in Vegas that were less productive for the Heat, but since they were signed to contracts and invited to training camp I guess Gladness warranted an invitation, too.  However, I don't expect him to be a serious threat to make the team based on the premise that the first to sign shall be the last ones cut and the last ones signed will be the first ones cut.

      For Anthony Mason, Jr. I'll use his college numbers to evaluate whether he should make the team over the bottom three. Mason's college productivity will be measured by Win Score per 40 minutes (WS40) using the same method as the Wages of Wins Journal.

      As a 6'7", 209 lb. forward, Mason produced a 7.4 WS40 last season at St. John's University (see the SR/College Basketball site for his stats). An average NCAA small forward produced a 9.95 WS40 last season. That leaves Mason with a position-adjusted WS40 (PAWS40) of 7.6. From 1995-2009, the average PAWS40 for a player selected out of college was just about 10.0. That means Anthony Mason, Jr. is a below average college prospect for the NBA (which explains why he wasn't drafted). Here's how Mason compares to the other players drafted by the Heat this year:

      PLAYER - PAWS40
      Dexter Pittman - 11.3
      Da'Sean Butler - 8.3
      Anthony Mason, Jr. - 7.6

      Maybe Mason will challenge for Butler's spot (if he even has one) while he recovers from blowing his knee out in the Final Four, but the numbers don't seem to indicate he should pose much of a threat to Pittman when it comes to making the Heat roster. At this point, it's time for a PAWS40 disclaimer from the Wages of Wins Journal:

      "[I]t must be emphasized (as has been noted in prior discussions of the draft), PAWS40 is correlated with future performance in the NBA. But it is not a crystal ball. So just because a player is above average, that does not mean he will be an above average NBA player. And below average players with respect to PAWS40 might become above average NBA players."

      So there's a chance that Mason could exceed expectations in training camp and draining jumpers over LeBron James is a good start but it's more likely that he'll be cut before October 26th. Or perhaps Mason Jr. will start to play more like his father. Anthony Mason, Sr. produced an 11.6 Win Score his senior year at Tennessee State in 1988 and produced an 11.7 Win Score in 2001 with the Miami Heat, which translates to an estimated wins produced per 48 minutes of 0.146 (average EWP48 is 0.100). Anthony Mason, Sr. was an above average player for Miami, but if his son was going to follow in his footsteps I think he would have been more productive last season at St. John's. I wouldn't be surprised if he ends up in the D-League like the son of another famous Knickerbocker.

      Tuesday, September 28, 2010

      ESPN - Where Biting Happens

      For Heat, an L.A. story - TrueHoop Blog - ESPN

      Thanks to Devin Dignam of the NBeh? blog for alerting me to the fact that ESPN is biting my style (see link above). We'll see which blog is more interesting this season. I accept the challenge.

      Friday, September 17, 2010

      Who Is The Greatest Forward In Miami Heat History? Not LeBron James. Not Yet.

      The Greatest Heat Team of All Time - ESPN

      ESPN.com has a great app (click the link above) that allows fans to pick the best players of all-time for your favorite team so I decided to take some time to identify the most productive Heat players from the ESPN.com app using player data from basketball-reference.com to estimate the Wins Produced by each player.

      Sunday, September 5, 2010

      Arachnophobia: Why The Heat Should Fear The Durantula

      I just posted a new Bleacher Report article on Team USA summarizing their performance in the preliminary round of the 201 FIBA World Championships. Durant's performance after 5 games surpassed LeBron's performance in the 2008 Olympics. Check it out:

      Arachnophobia: Why FIBA Should Fear The Durantula At The World Championships | World Domination: Kevin Durant Is Leading Team USA to The World Championship | Bleacher Report

      To see updated 2010 Team USA stats for Durant, check out this spreadsheet.

      To see 2008 Team USA stats for LeBron, check out this spreadsheet.


      Leave a comment on who you think will be the better small forward this NBA season.